
-
-
 Cardiology
-
 Clinical Oncology
-
 Dental
-
 Dermatology
-
 Ear, Nose, Throat (ENT)
-
 Endocrinology
-
 Gastroenterology
-
 General Surgery
-
 Gynecology & Obstetrics
-
 Interventional Cardiology
-
 Nephrology
-
 Neurology
-
 Oncology Surgery
-
 Ophthalmology
-
 Orthopedics
-
 Pediatrics
-
 Pediatrics Surgery
-
 Physiotherapy
-
 Plastic Surgery
-
 Psychiatry & Psychology
-
 Radiology
-
 Urology
-
 Vascular Surgery
-

 Anatomy Lab Equipments
 Biochemistry Lab Equipments
 Biology Lab Equipments
 Chemistry Lab Equipments
 Cytology Lab Equipments
 Cytopathology Lab Equipments
 Dental Lab Equipments
 Forensic Lab Equipments
 Genetics Lab Equipments
 Hematology Lab Equipments
 Histology Lab Equipments
 Histopathology Lab Equipments
 Mathematics Lab Equipments
 Microbiology Lab Equipments
 Molecular Biology Lab Equipments
 Pathology Lab Equipments
 Pharmaceutical Lab Equipments
 Physics Lab Equipments
 Radiology Lab Equipments
 Science Lab Kit’s
 Toxicology Lab Equipments

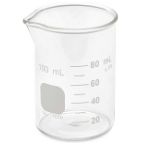
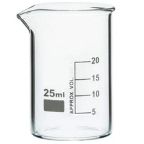 Borosilicate Glass Beaker
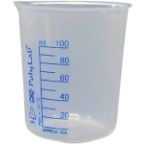 Plastic Beaker (Euro Design)
 Plastic Beaker (Printed Graduation)
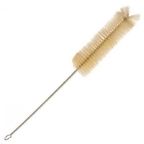
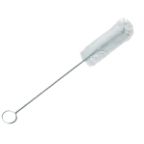 Test Tube Brush
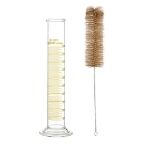 Measuring Cylinder Brush
 Conical Flask Brush
 Volumetric Flask Brush
 Round Bottom Flask Brush
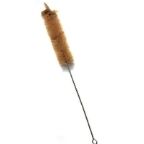
 Glass Beaker Brush
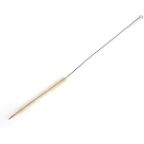 Pipette Brush
 Wash Bottle Brush
 Borosilicate Büchner Flask
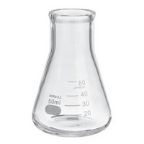
 Borosilicate Erlenmeyer/Conical Flask
 Borosilicate Pear-Shaped Flask
 Borosilicate Round Bottom Flask
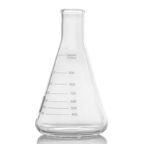
 Plastic Conical Flask
 Plastic Volumetric Flask
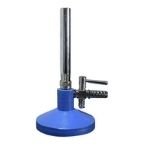 Bunsen Burner
 Spirit Lamp
 Borosilicate Glass Burette
 Plastic Burette
 Capillary Tube
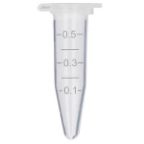 Centrifuge Tube
 Test Tube
 Ria Vial
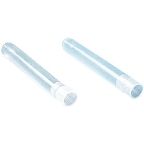
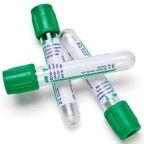 Vacutainer Tubes
 Syringes
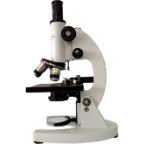 Student Microscope
 Binocular Microscope
 Dissecting Microscope
 Microscope Glass Slides
 Cover Slip
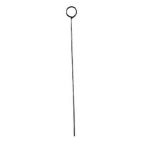 Inoculating Loop
 Slide Box
 Lamps
Lamps
 Oils
Oils
 Beaker Tongs
 Crucible Tongs
 Flask Tongs
 Borosilicate Glass Funnel
 Plastic Funnels
 Wash Bottle
 Borosilicate Glass Reagent Bottle
 Plastic Reagent Bottle
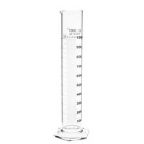
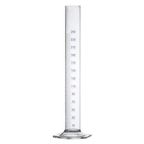 Borosilicate Measuring Cylinder
 Plastic Measuring Cylinder
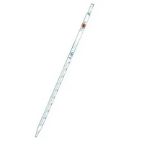
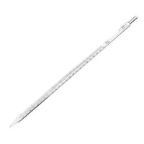 Borosilicate Glass Graduated Pipette
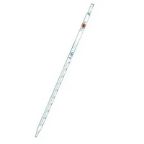 Borosilicate Glass Volumetric Pipette
 HB Pipette
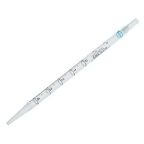
 Pasteur Pipette
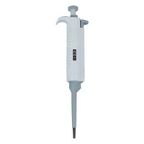
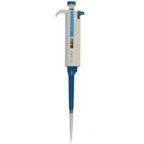 Micropipettes
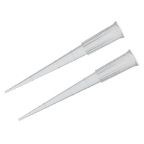 Micropipette Tips
 Filter Paper
 Litmus Paper
 pH Paper
 Chromatography Paper
 Plastic Petri Plates (Sterile)
 Glass Petri Plates (Non-Sterile)
 Safety Goggles
 Lab Coats
 Gloves
 Masks
Masks
 Shoe Covers
 Hair & Beard Covers
 Steel Spatula
 Plastic Spatula
 Hitachi Sample Cup
 Plastic Scoop
 Plastic Medicine Cup
 Dissecting Tool Kit
 Dissecting Forceps
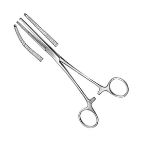 Hemostatic Forceps
 Thumb Forceps / Tweezers
 Blood Culture Bottle
 Urine Container
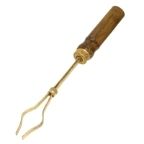
 Wooden Swab Stick
 Test Tube Holder
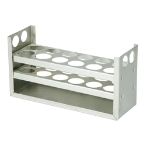 Test Tube Racks
 Magnifying Glass
 Watch Glass
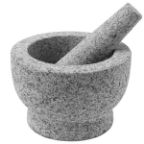 Mortar and Pestle
 Coplin Jar
 Plastic Stirrer
 Glass Stirrer
 Crucible
 Tripod
 Wire Mesh
 Laboratory Thermometer
 Tourniquet
 Alcohol Swab
 Blood Lancet
 Bandage
 Gloves & Masks


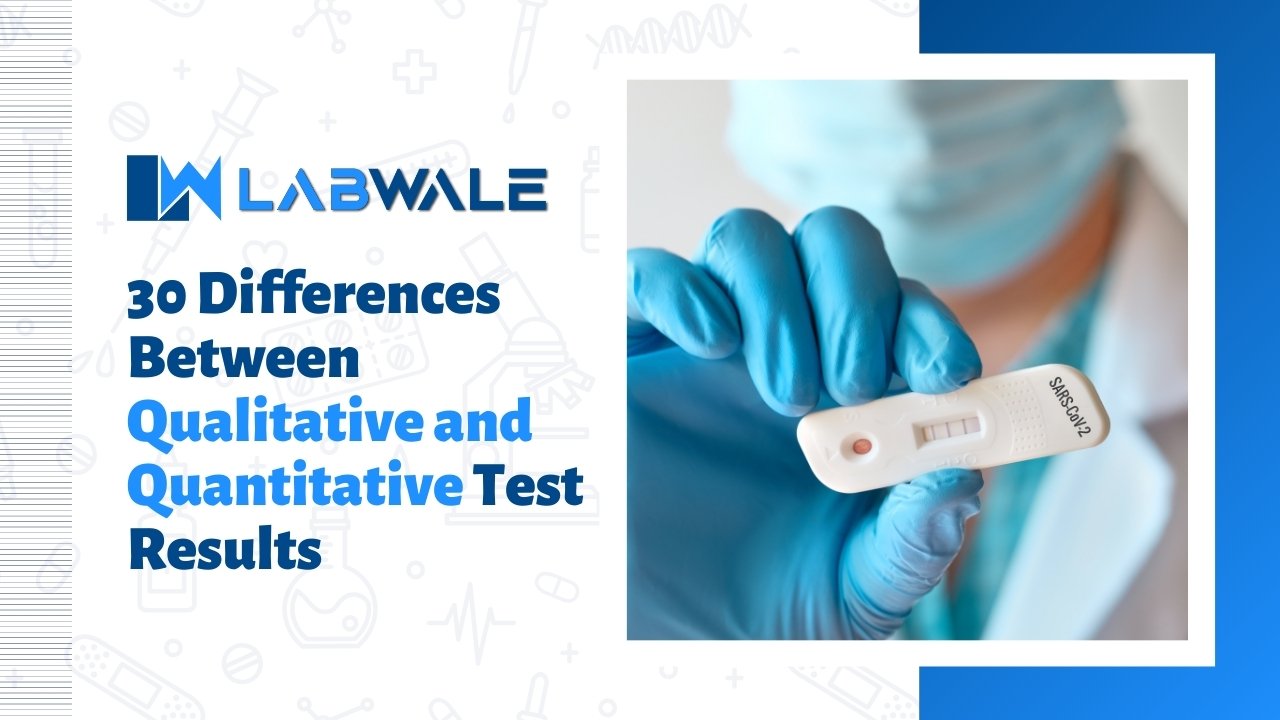
30 Differences Between Qualitative and Quantitative Test Results
Contents
- Frequently Asked Questions (FAQ’S)
- Q1. What are the drawbacks of using qualitative test results?
- Q2. How can I increase the qualitative test results’ reliability?
- Q3. What role does dependability play in the outcomes of quantitative tests?
- Q4. Which kinds of qualitative testing are most frequently used?
- Q5. How does user feedback fit into the qualitative testing process?
- Q6. What distinguishes test findings from one another, qualitative and quantitative?
Test findings that are qualitative and quantitative are two different categories of data that offer different kinds of information.
Test results that are classified as qualitative are descriptive in character as opposed to quantitative or numerical. Rather than being stated in terms of precise numbers, these results are frequently described in terms of traits, features, or attributes. In many disciplines, such as science, research, and product development, qualitative testing is a technique used to get data about a subject’s characteristics or attributes without depending solely on numerical measures.
Qualitative test results, for instance, could characterize a substance’s color, texture, odor, or other sensory attributes in a scientific investigation. Qualitative data in social science research may be analyzed through observations or interview replies that shed light on attitudes, actions, or experiences.
The measurements or findings from a testing procedure that uses numerical data are referred to as quantitative test results. These results may be statistically analyzed because they are expressed in terms of quantities. Scientific research, engineering, banking, and many other domains where accurate measurements and numerical data are essential frequently use quantitative testing.
Quantitative test findings, for instance, can include measurements of temperature, weight, length, or concentration in a scientific experiment. Metrics like reaction time, error rates, or the quantity of transactions handled in a given amount of time are examples of quantitative results in software testing. Quantitative results in educational testing may be exam or assessment scores.
| S.No. | Aspects | Subject | Subject |
| 1. | Data Type | Qualitative data is descriptive and categorical. | Quantitative data is numerical and measurable. |
| 2. | Measurement | Focuses on non-numeric characteristics. | Focuses on measurable quantities. |
| 3. | Precision | Provides an in-depth understanding of phenomena. | Provides precise measurements and figures. |
| 4. | Analysis | Relies on interpretation and subjective judgment. | Requires statistical analysis and mathematical calculations. |
| 5. | Objectivity | Subjective interpretation is common. | Objective measurements are standard. |
| 6. | Scale | Usually employs nominal or ordinal scales. | Utilizes interval or ratio scales. |
| 7. | Data Collection | Relies on observations and interviews. | Utilizes surveys and experiments. |
| 8. | Variables | Deals with non-numeric variables. | Deals with numeric variables. |
| 9. | Sample Size | Smaller sample sizes might suffice. | Larger sample sizes might be necessary for accuracy. |
| 10. | Trends | Emphasizes trends and patterns in data. | Emphasizes numerical relationships and trends. |
| 11. | Statistical Analysis | Limited use of statistical tools. | Requires statistical tests and models. |
| 12. | Findings | Results are often exploratory and nuanced. | Results are precise and quantifiable. |
| 13. | Validity | Focuses on the validity of interpretation. | Focuses on the validity of measurement instruments. |
| 14. | Conclusions | Draws conclusions based on subjective analysis. | Draws conclusions based on numerical evidence. |
| 15. | Experimentation | Often employs qualitative research methods. | Often employs quantitative research methods. |
| 16. | Scope | Focuses on understanding complex social phenomena. | Focuses on establishing numerical relationships. |
| 17. | Generalization | Limited ability to generalize findings. | Allows for broader generalizations. |
| 18. | Bias | Subjectivity might introduce researcher bias. | Strives to minimize bias through rigorous methods. |
| 19. | Reporting | Focuses on narrative explanations and themes. | Requires detailed numerical presentations and graphs. |
| 20. | Hypothesis Testing | Not often used in qualitative analysis. | Crucial for validating hypotheses in quantitative studies. |
| 21. | Application | Often used in social sciences and humanities. | Commonly used in natural and physical sciences. |
| 22. | Data Representation | Utilizes word clouds, diagrams, and narratives. | Utilizes charts, graphs, and tables. |
| 23. | Predictive Power | Limited predictive power in qualitative findings. | Often has strong predictive capabilities. |
| 24. | Precision of Results | Results might lack precision and accuracy. | Results are precise and accurate. |
| 25. | Interpretation | Relies heavily on the interpretation of the researcher. | Requires less subjective interpretation. |
| 26. | Time and Resources | Often requires less time and resources. | Often requires substantial time and resources. |
| 27. | External Validity | Limited external validity of findings. | High external validity due to numeric representation. |
| 28. | Research Questions | Tends to explore complex, open-ended questions. | Tends to answer specific, measurable questions. |
| 29. | Sample Selection | Often employs purposive or convenience sampling. | Often requires random or stratified sampling. |
| 30. | Data Presentation | Emphasizes text, quotations, and narratives. | Emphasizes numerical data and statistical analysis. |
Frequently Asked Questions (FAQ’S)
Q1. What are the drawbacks of using qualitative test results?
Qualitative results can be difficult to generalize, subjective, and dependent on context. The viewpoint of the researcher can also affect how the data is interpreted.
Q2. How can I increase the qualitative test results’ reliability?
Maintaining transparency throughout the research process, employing triangulation—validating findings using different methods or sources—and following consistent, well-defined processes are all important ways to improve the reliability of qualitative research.
Q3. What role does dependability play in the outcomes of quantitative tests?
A test is said to be reliable if it consistently yields the same results under consistent circumstances. It is essential for proving that quantitative measurements are reliable and accurate.
Q4. Which kinds of qualitative testing are most frequently used?
Usability testing, exploratory testing, user experience (UX) testing, and acceptance testing are examples of common qualitative tests.
Q5. How does user feedback fit into the qualitative testing process?
In qualitative testing, user feedback is essential because it sheds light on how users engage with the product, the difficulties they encounter, and how satisfied they are overall. Making well-informed selections aids in enhancing the final result.
Q6. What distinguishes test findings from one another, qualitative and quantitative?
While quantitative outcomes include numerical data and measurements, qualitative results typically define traits or features in a non-numerical manner.
 Cardiology
 Clinical Oncology